Google Ads pricing operates through a real-time auction system where your actual cost per click depends on bid competition, Quality Score, and Ad Rank thresholds rather than a fixed price list. The cross-industry average CPC on Search reached $2.96 in Q1 2026, though individual costs range from under $1 to over $6 depending on your vertical.
This guide covers CPC pricing mechanics and cost factors, campaign-type benchmarks, monthly budget frameworks by business size, bidding strategies and budget calculation methods, waste reduction tactics, scaling signals, and hidden costs that inflate true spend.
Your cost per click shifts based on industry, keyword competition, Quality Score, geographic targeting, and ad scheduling. Quality Score acts as a discount lever; improving it lowers CPC while boosting ad position. Shopping ads average $0.66 per click globally, Search averages $2.96, and YouTube video ads average $3.56 per view action.
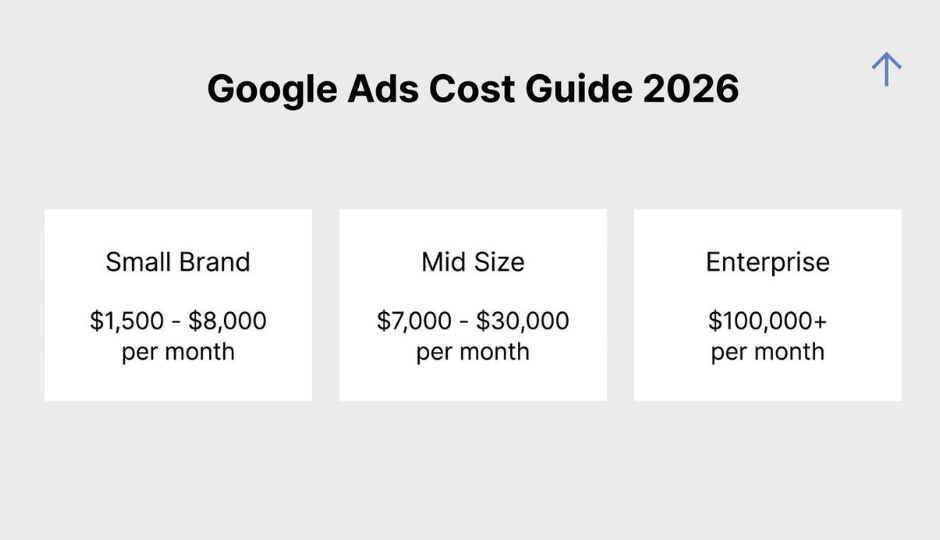
Monthly budgets range from $1,500 to $8,000 for small ecommerce brands, $7,000 to $30,000 for mid-size DTC brands, and $100,000+ for enterprise accounts. Choosing between Manual CPC, Target ROAS, and Maximize Conversions depends on your conversion volume and data maturity.
Calculating budget from revenue goals requires working backward through ROAS targets, customer lifetime value, and conversion rates. Google allows daily overspend up to 2x your average daily budget but caps monthly charges at 30.4 times that figure.
Negative keywords, audience exclusions, and landing page alignment eliminate wasted clicks within one to two weeks of implementation. Scaling decisions hinge on sustained above-target ROAS for 14+ days and impression share lost to budget exceeding 20%.
Agency fees add 15% to 20% on top of raw ad spend, and attribution gaps from privacy changes have reduced reported accuracy by 40% to 60% on many accounts. Fragmented data across disconnected tools compounds these issues, making unified commerce systems essential for accurate budget allocation.
Google Ads pricing works through a real-time auction system where advertisers bid on keywords, and Google determines ad placement based on bid amount, ad quality, and competitive factors. The actual cost per click you pay depends on several interacting variables rather than a fixed price list.
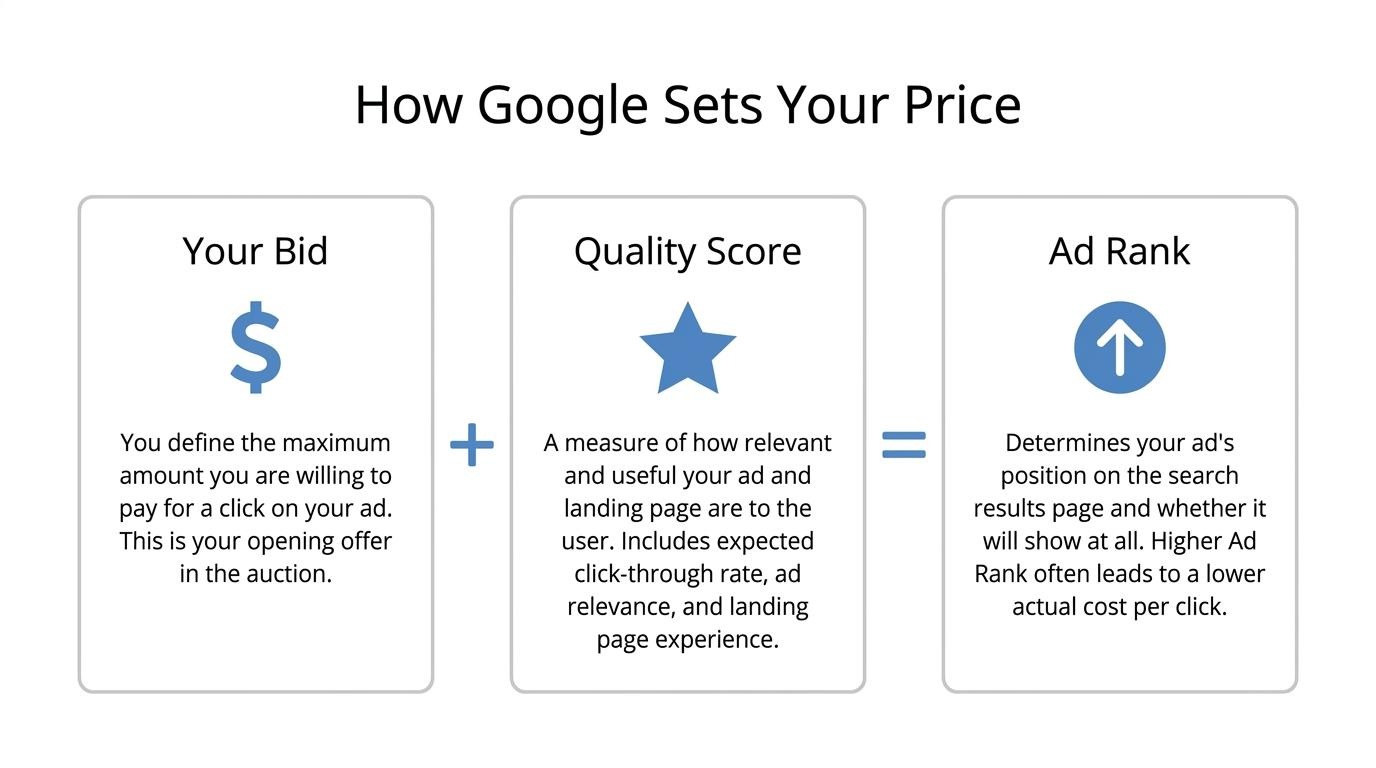
Each time a user searches, Google runs an instant auction among all advertisers targeting that query. Your maximum bid sets the ceiling you are willing to pay, but the actual CPC is typically lower. Google calculates Ad Rank by combining your bid with Quality Score, which evaluates expected click-through rate, ad relevance, and landing page experience. The advertiser with the highest Ad Rank wins the top position, paying only slightly more than the next competitor's Ad Rank threshold requires.
This auction-based model means pricing fluctuates constantly. According to Digital Applied, the cross-industry average CPC on Search reached $2.96 in Q1 2026, up 12% year-over-year from $2.64 in Q1 2025. However, individual CPCs range from under $1 in low-competition niches to over $6 in sectors like legal services and insurance.
Three core mechanics determine what you ultimately pay:
Because Google never charges more than your maximum bid and often charges less, the system rewards relevance over raw spending power. A well-optimized campaign with strong Quality Scores can consistently pay less per click than a higher-bidding competitor with poor ad relevance. Understanding these mechanics is the foundation for controlling costs, which starts with knowing exactly what factors determine your cost per click.
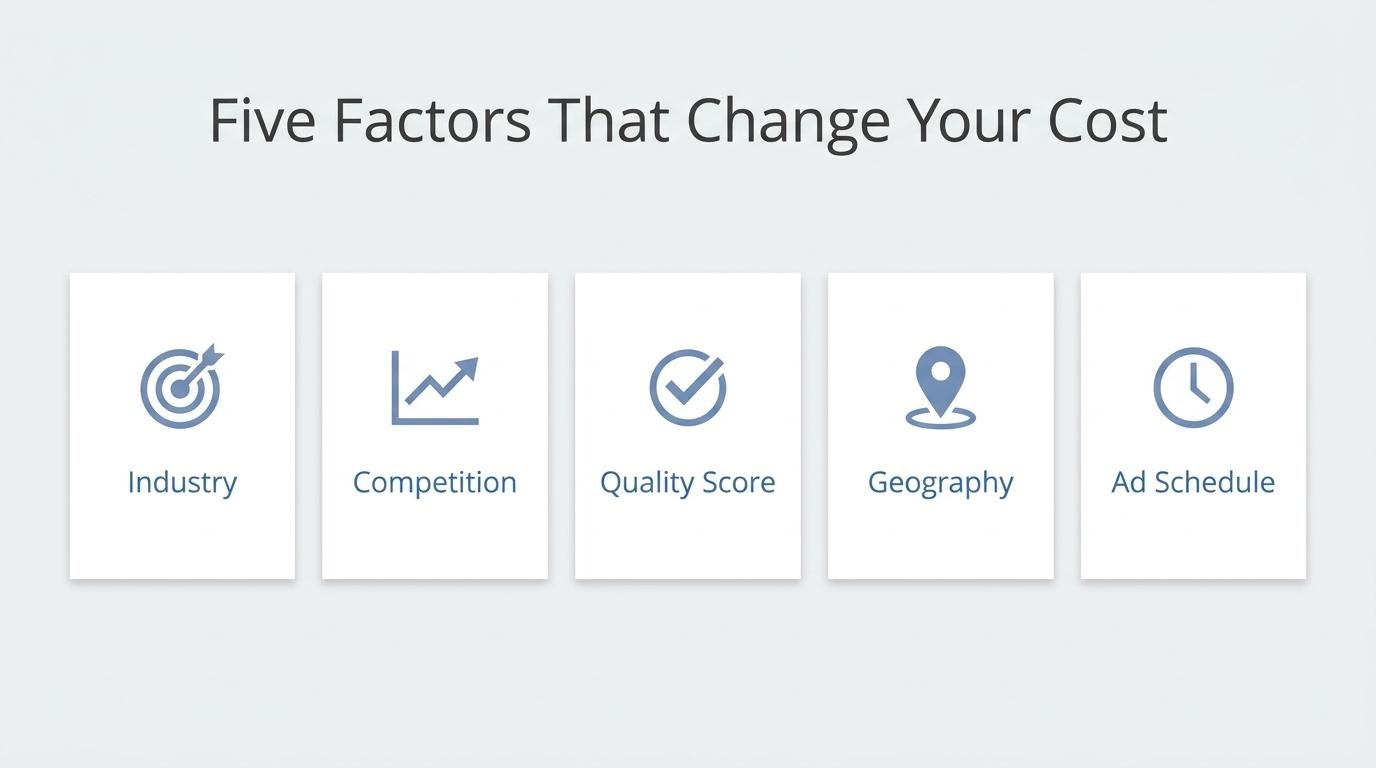
Your Google Ads cost per click is determined by industry, keyword competition, Quality Score, geographic targeting, and ad scheduling. Each factor shifts what you actually pay per auction.
Industry affects your cost per click because advertiser density and customer value vary dramatically across verticals. Legal services and insurance command the highest CPCs due to high client lifetime values, while retail and ecommerce typically see lower per-click costs. According to Store Growers' Q1 2026 benchmarks, average Search CPC for Legal Services sits at $6.75 and Insurance at $6.22, compared to $3.33 for B2B/SaaS.
Advertisers in high-margin industries tolerate expensive clicks because a single conversion justifies the spend. For ecommerce brands, this dynamic works in your favor since product-level CPCs often remain well below service-industry averages.
Keyword competition influences CPC by increasing the number of advertisers bidding on the same search terms, which drives auction prices higher. High-intent commercial keywords attract more bidders than informational queries, creating significant price gaps within the same industry.
Branded keywords typically cost less because fewer competitors bid on them. Generic, high-volume terms like "buy shoes online" face intense competition. Long-tail keywords with three or more words reduce competition while often delivering stronger purchase intent. Prioritizing specific, lower-competition phrases is one of the fastest ways to lower CPC without sacrificing conversion quality.
Quality Score lowers your actual CPC by improving your Ad Rank position relative to competitors, which means Google charges you less per click for the same or better placement. Quality Score evaluates three components:
According to Adalysis, improving Quality Score allows ads to show more often, increase position, and decrease CPC because it directly determines how Google calculates Ad Rank. A higher score signals to Google that your ad delivers value to searchers, so the system rewards you with lower costs. Neglecting landing page quality alone can inflate CPC substantially; optimizing all three components compounds savings over time.
Geographic targeting changes what you pay because advertiser competition and consumer purchasing power differ by region. Urban markets with dense populations and high incomes attract more bidders, raising CPCs compared to suburban or rural areas.
Targeting a major metro like New York or Los Angeles costs more per click than targeting smaller cities for the same keyword. Narrowing your geographic scope to high-performing zip codes can reduce wasted spend on clicks from areas that rarely convert, effectively lowering your blended CPC.
Ad scheduling impacts cost per click by concentrating your ads during time windows when competition and demand fluctuate. Peak business hours typically attract more advertisers bidding simultaneously, which inflates CPCs.
Running ads during off-peak hours or days when fewer competitors are active can reduce per-click costs. However, lower competition does not always mean better results; conversion rates also shift by time of day. The most cost-efficient approach pairs scheduling data with conversion performance, serving ads only during windows where both CPC and conversion rate favor profitability.
With these CPC factors established, the next step is understanding costs by campaign type.
Google Ads costs vary significantly depending on the campaign type you choose. Search ads carry the highest average CPC, while Display and Shopping campaigns offer lower click costs with different intent signals.
Search ads cost an average of $2.96 per click across industries as of Q1 2026, according to Digital Applied's benchmark report. High-competition verticals pay considerably more; legal services averages $6.75 per click and insurance sits at $6.22, while B2B/SaaS averages $3.33. These figures reflect bottom-of-funnel intent, where users actively search for solutions. For ecommerce brands, search CPCs tend to cluster between $1.50 and $4.00 depending on product category and keyword specificity. Branded terms cost less; generic category terms cost more.
Shopping ads cost an average of $0.66 per click globally, making them significantly cheaper than Search on a per-click basis. According to OwlClaw Technologies' benchmark data, competitive categories like electronics exceed $1.20 per click, while jewelry achieves the highest average ROAS at 8.2x. The lower CPC reflects how Shopping campaigns operate: Google matches product feeds to queries rather than relying on keyword bids alone. For DTC brands with strong product margins, Shopping campaigns often deliver the best cost-to-conversion ratio in a Google Ads account.
Display ads cost between $0.50 and $2.00 per click on average, positioning them among the least expensive Google Ads formats. The lower cost reflects the nature of Display inventory: ads appear across Google's partner network while users browse content rather than actively searching. Click-through rates are lower than Search, typically under 1%, so the reduced CPC compensates for weaker purchase intent. Display works best for retargeting warm audiences or building brand awareness at scale rather than driving immediate conversions from cold traffic.
YouTube video ads cost an average of $3.56 per view action, with observed ranges spanning $0.05 to $10.71 depending on format, targeting, and industry. According to AdConversion's 2025-2026 benchmark data, cost-per-view for skippable in-stream ads falls at the lower end, while action-based formats like TrueView for Action command premium pricing. YouTube's auction considers watch time, engagement signals, and audience targeting precision. For brands running awareness campaigns, cost-per-thousand-impressions bidding often proves more efficient than per-view models.
Performance Max campaigns cost varies because they distribute budget automatically across Search, Shopping, Display, YouTube, Gmail, and Discover inventory. There is no single CPC benchmark since Google's algorithm allocates spend toward whichever placement drives conversions most efficiently for your goals. CPCs within a Performance Max campaign blend the ranges of all underlying channels, often averaging between $1.00 and $4.00 for ecommerce accounts. The trade-off is reduced transparency: you cannot see exactly how much goes to each placement type without third-party reporting tools.
With campaign-type costs established, the next step is determining how much total monthly budget aligns with your revenue goals.
You should spend between $1,500 and $100,000+ per month on Google Ads depending on your business size and growth goals. The right budget varies by brand stage, competitive landscape, and target ROAS.
A small ecommerce brand should spend $1,500 to $8,000 per month on Google Ads. According to Aimers Agency, a good Google Ads budget for small and local businesses ranges from $1,500 to $8,000 monthly. Brands at this stage typically allocate spend toward high-intent Shopping campaigns and branded search, where cost per click remains lower and purchase intent is strongest. Starting at the lower end allows newer stores to gather conversion data before scaling. For most small ecommerce brands, committing at least $2,000 monthly provides enough click volume to optimize meaningfully within the first 30 days.
A mid-size DTC brand should spend $7,000 to $30,000 per month on Google Ads. This range supports multi-campaign structures across Search, Shopping, and Performance Max while generating enough conversion volume for automated bidding strategies to function effectively. Brands in this tier are typically scaling beyond single-channel reliance and need sufficient budget to compete on category keywords, not just branded terms. The overlap between the small and mid-size ranges ($7,000 to $8,000) reflects a natural transition zone where brands test higher spend before committing to sustained scale.
An enterprise brand should spend $100,000 or more per month on Google Ads. At this level, ad spend alone represents one budget layer; management fees add another. According to ALM Corp's 2026 pricing analysis, enterprise-level Google Ads management fees for accounts spending over $100,000 monthly typically range from $8,000 to $15,000 or more. Enterprise budgets fund complex, multi-market campaign architectures spanning Search, Shopping, YouTube, Display, and Performance Max simultaneously. The critical metric at this scale shifts from absolute spend to incremental ROAS per additional dollar invested.
With monthly ranges established by brand stage, the next step is choosing the bidding strategy that determines how each dollar gets deployed.
The Google Ads bidding strategies you should use in 2026 depend on your data maturity, conversion volume, and campaign goals. Manual CPC, Target ROAS, and Maximize Conversions each serve distinct scenarios.
You should use Manual CPC bidding when launching new campaigns, testing new keywords, or operating with fewer than 30 conversions per month. Manual CPC gives you direct control over maximum bid amounts at the keyword level, which prevents automated systems from overspending on unproven traffic. This strategy works best during the data-gathering phase, when Google's algorithms lack sufficient conversion history to optimize effectively. Once a campaign accumulates consistent conversion data over several weeks, transitioning to an automated strategy typically yields better efficiency. For most scaling brands, Manual CPC is a temporary foundation rather than a long-term approach.
You should use Target ROAS bidding when your campaigns have stable conversion data and a clearly defined return threshold. This strategy tells Google's algorithm to maximize conversion value while hitting a specific return on ad spend. According to Stacked SaaS, scaling signals in 2026 include consistent ROAS above target for 14+ days and impression share lost to budget exceeding 20% in high-performing campaigns. Those two indicators confirm both algorithmic stability and headroom for growth. Target ROAS requires at least 15 conversions in the past 30 days to function reliably; without that volume, the algorithm makes erratic bid adjustments that inflate costs.
You should use Maximize Conversions bidding when your primary goal is volume rather than efficiency, and your account has accurate conversion tracking in place. This strategy spends your entire daily budget to generate the highest possible number of conversions without a cost-per-acquisition cap. It suits campaigns in growth phases where market share matters more than margin, or situations where conversion values are relatively uniform. Adding a target CPA constraint later refines the strategy once baseline performance data stabilizes. Without that constraint, Maximize Conversions will aggressively exhaust budget regardless of acquisition cost.
With bidding strategy selected, calculating your total budget from revenue goals ensures spend aligns with business outcomes.
You calculate your Google Ads budget from revenue goals by working backward through ROAS targets, customer lifetime value, and conversion rates. Each variable shapes the maximum you can spend profitably.
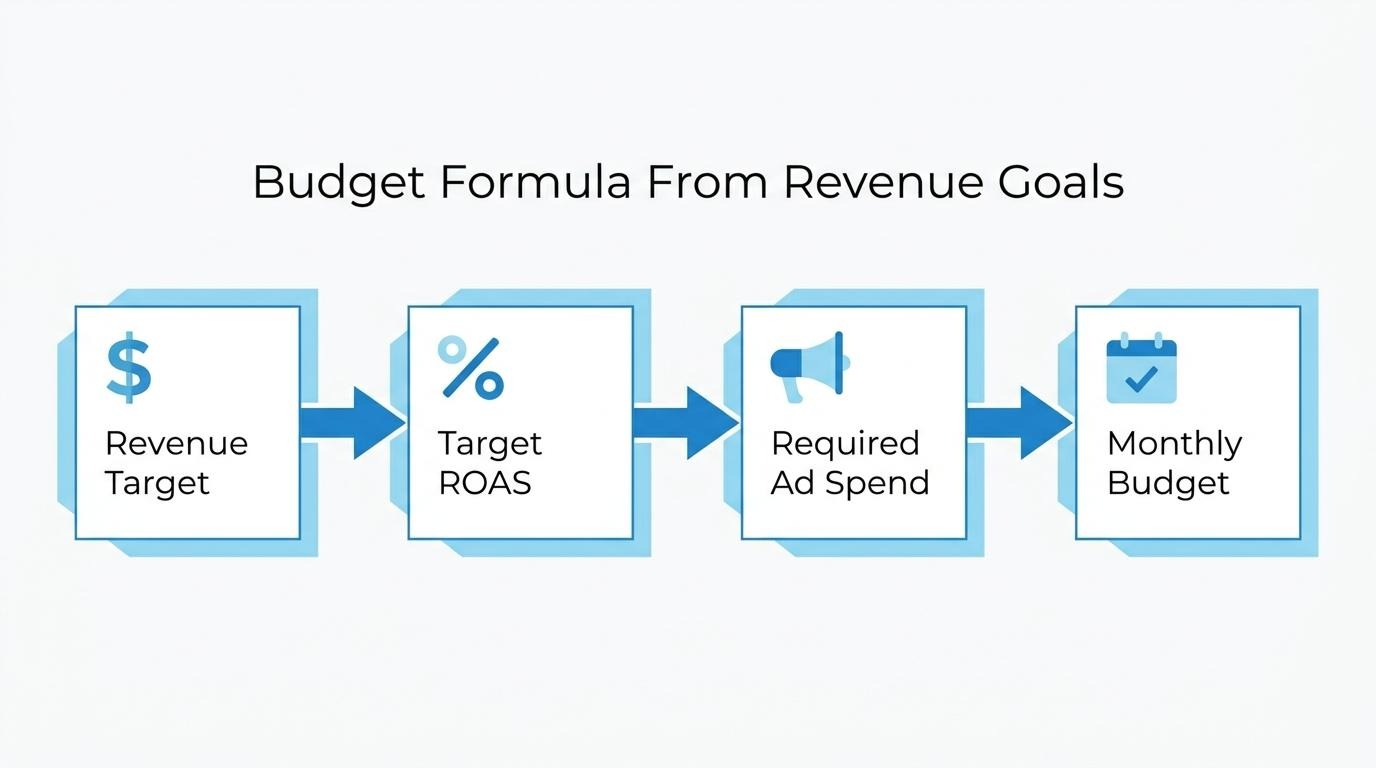
You work backward from a target ROAS by dividing your revenue goal by your desired return on ad spend. The formula is straightforward: Ad Spend = Revenue Target ÷ Target ROAS.
If you need $100,000 in revenue and target a 4x ROAS, your required ad budget is $25,000. This calculation assumes every dollar of attributed revenue flows from ad-driven conversions, so most brands apply a blended attribution discount of 10–20% to account for organic and direct contributions.
For ecommerce operators managing multiple channels, starting with a conservative ROAS target and adjusting monthly based on actual performance data produces more accurate budget forecasts than annual projections alone.
You factor in Customer Lifetime Value by using it to set your maximum allowable acquisition cost. According to Saras Analytics, CLV is integrated into budget math by multiplying the average customer value by the average customer lifespan to determine the maximum allowable Customer Acquisition Cost (CAC).
A brand with a $200 average order value and a 3-year customer lifespan has a CLV of $600. If the target CAC-to-CLV ratio is 1:3, the maximum CAC becomes $200 per customer. This figure, divided by your conversion rate, determines how much you can bid per click without eroding profitability.
Brands that calculate budgets on first-purchase revenue alone consistently underspend on acquisition, ceding market share to competitors who price in repeat purchases.
You account for conversion rate in budget math by dividing your target CAC by your landing page conversion rate to find your maximum cost per click.
The formula works as follows:
A 3% conversion rate with a $50 target CAC means you can afford $1.50 per click. At a 1.5% conversion rate, that same CAC tolerance drops your max CPC to $0.75. Small conversion rate improvements compress budget requirements significantly; a 1% increase in conversion rate often reduces required ad spend by 20–30% for the same revenue output.
With budget math grounded in real conversion data, setting your daily budget correctly ensures Google spends that allocation as intended.
You set a daily budget in Google Ads by dividing your desired monthly spend by 30.4 (the average days per month). Google uses this average daily budget as a target but can overspend on individual days.
Google's daily budget overspend rule works by allowing campaigns to spend up to twice the average daily budget on any single day. This compensates for lower-traffic days, ensuring ads capture demand during peak periods without manual intervention.
According to Google Support, the daily spending limit is exactly 2x your average daily budget, designed to capitalize on traffic fluctuations (Stacked SaaS, 2026). However, Google guarantees that monthly charges will never exceed 30.4 multiplied by your average daily budget. If a campaign does overspend beyond that monthly cap, Google issues a credit.
For a campaign with a $50 daily budget, actual daily spend could reach $100 on high-traffic days. The monthly cap remains $1,520 (30.4 × $50). Monitoring spend at the monthly level rather than panicking over daily fluctuations gives a more accurate picture of pacing.
You split budget across multiple campaigns by allocating based on each campaign's revenue contribution and efficiency metrics, not by dividing evenly.
A practical framework for budget allocation:
Campaigns with high impression share lost to budget deserve priority increases, since that metric signals missed revenue from qualified searches. Conversely, campaigns with declining conversion rates or rising CPAs should have budget redistributed elsewhere.
Shared budgets in Google Ads let multiple campaigns draw from a single pool, which simplifies management but reduces control over individual campaign pacing. For brands running separate Search, Shopping, and Performance Max campaigns, individual budgets provide clearer performance signals per channel.
With daily budgets and campaign allocations configured, the next step is identifying where spend gets wasted.
You reduce wasted spend in Google Ads by eliminating clicks that will never convert. Negative keywords, audience exclusions, and landing page alignment are the three primary levers.
Negative keywords prevent wasted clicks by blocking your ads from showing on irrelevant search queries that share surface-level terms with your target keywords. When someone searches "free CRM software" and you sell enterprise subscriptions, a negative keyword on "free" stops Google from spending your budget on that click.
According to Infront Marketing, initial waste reduction in Google Ads typically occurs within 1-2 weeks through the application of negative keywords and bid adjustments. Building a negative keyword list is not a one-time task; weekly search term reviews catch new irrelevant queries as campaigns scale and match types broaden.
Audience exclusion cuts irrelevant spend by preventing your ads from reaching user segments unlikely to convert. You can exclude audiences based on demographics, interests, or past behavior.
Common exclusions that reduce waste include:
Layering exclusions onto campaigns narrows delivery to qualified prospects, which concentrates budget on users with genuine purchase intent rather than broad, untargeted impressions.
Landing page relevance affects cost efficiency by directly influencing your Quality Score, which determines how much you actually pay per click. A 2026 analysis from Get Ryze found that poor landing page experience costs advertisers an average of 47% higher CPC and results in 23% lower ad visibility.
Google evaluates whether your landing page delivers on the promise your ad makes. When the page content matches the keyword and ad copy closely, Quality Score rises and your actual CPC drops within the same auction. Misaligned pages force you to outbid competitors through budget alone rather than relevance.
Understanding where spend leaks occur sets the stage for knowing when to scale budget confidently.
You should scale your Google Ads budget up when performance metrics consistently exceed targets, and scale down when incremental spend stops producing proportional returns. The following subsections cover key signals for each direction.
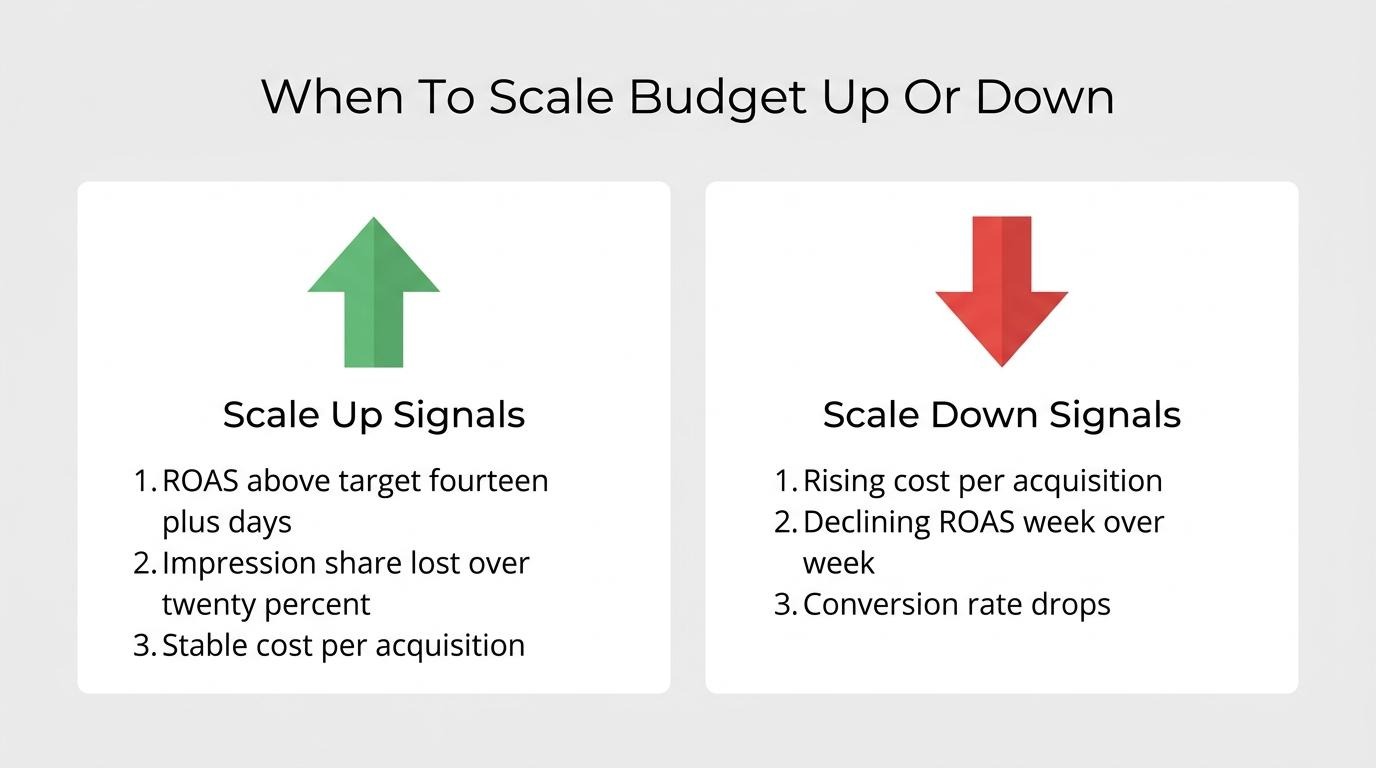
The metrics that signal you should increase budget are consistent above-target ROAS, high impression share loss due to budget, and stable or improving cost per acquisition over a sustained period. According to Stacked SaaS, scaling signals in 2026 include consistent ROAS above target for 14+ days and impression share lost to budget exceeding 20% in high-performing campaigns.
Additional indicators worth monitoring:
When these metrics converge, the campaign is leaving revenue on the table. Increasing budget in 10–20% increments, rather than doubling overnight, preserves algorithmic stability while capturing missed impressions.
The signs that indicate diminishing returns are rising CPA without corresponding revenue gains, flattening conversion volume despite increased spend, and declining ROAS week over week. These patterns suggest the campaign has saturated its addressable audience at the current targeting settings.
Specific warning signals include:
Diminishing returns often appear faster in narrow, high-intent keyword sets than in broader campaigns. When marginal cost exceeds marginal value, the correct move is pausing the increase, tightening targeting or audience segments, and reallocating budget toward underserved campaigns still showing headroom.
Understanding when to hold or reduce spend protects margins as you evaluate the full cost picture behind your ad account.
Hidden costs affect your true Google Ads spend by adding management fees and attribution-driven waste on top of raw click costs. Below, we break down agency pricing models and how tracking gaps silently inflate budgets.
Management fees factor into total cost by adding 15% to 20% or more on top of your monthly ad spend, depending on the pricing model your agency uses. According to SaaSHero's 2026 agency pricing analysis, the percentage-of-spend model typically charges 15% to 20% of monthly ad spend as a management fee, meaning a $10,000 monthly budget actually costs $11,500 to $12,000 before a single optimization is made.
Flat-fee retainers offer an alternative, starting around $2,500 per month for cost predictability. Enterprise accounts spending over $100,000 monthly face management fees ranging from $8,000 to $15,000. The percentage-of-spend model creates a structural misalignment: agencies are incentivized to increase budgets rather than improve efficiency. For scaling DTC brands, this makes fee structure selection a budget decision as consequential as keyword targeting itself.
Tracking and attribution gaps inflate spend by making profitable campaigns appear unprofitable, triggering budget cuts to channels that are actually converting. With iOS App Tracking Transparency resulting in less than 25% opt-in rates for cross-app tracking in 2026, Google Ads attribution increasingly relies on modeling rather than direct measurement.
The practical impact is significant. Reported attribution accuracy has dropped 40% to 60% on many accounts due to privacy-driven reclassifications, according to a 2026 analysis by Lucid Media. This means advertisers misallocate budget based on incomplete data, often overspending on last-click channels while underfunding upper-funnel campaigns that actually drive conversions.
When ad spend data, customer records, and conversion paths live in disconnected tools, these gaps compound further, making unified data architecture essential for accurate budget decisions.
Fragmented data across tools undermines ad budget decisions by obscuring true campaign performance and inflating spend on misattributed conversions. Below, we cover what changes with unified systems and the key takeaways for Google Ads pricing.
What changes when ad spend and customer data live in one system is the ability to connect acquisition cost directly to downstream revenue per customer. According to a 2026 ResearchGate publication, strategic platform consolidation and standardized data architectures are essential to restoring revenue clarity and overcoming data silos in marketing organizations.
When ad performance, CRM, and purchase history exist in separate tools, teams lose visibility into which campaigns drive repeat buyers versus one-time purchasers. Budget decisions default to last-click metrics rather than true customer value. A unified system resolves this by tying every ad dollar to a single customer record across channels, enabling budget allocation based on lifetime value rather than session-level ROAS.
On SHOPLINE, ad spend data and customer lifecycle information live in the same system as the storefront, which removes the reconciliation gap between acquisition platforms and retention tools.
The key takeaways about Google Ads pricing and budgeting are:
According to ALM Corp's 2026 analysis, enterprise-level accounts spending over $100,000 monthly face management fees ranging from $8,000 to $15,000 or more. For scaling brands, the most impactful budget decision is not how much to spend, but how accurately you can attribute returns to specific campaigns and customer segments.