.png)
Markup and margin are two ways of expressing the same dollar profit as a percentage, divided by different base numbers. Markup divides profit by cost; margin divides profit by selling price. That single difference in denominator means a 50% markup produces only a 33.3% margin, and confusing the two quietly erodes profitability across every transaction.
This guide covers ecommerce pricing definitions, the formulas and conversion methods connecting both metrics, common confusion and its financial consequences, category-specific benchmarks, strategic application of each metric, and multichannel margin tracking.
Markup is the percentage added to a product's cost to set its selling price, while margin represents the share of revenue retained as profit. Both formulas use selling price and cost, but swapping the denominator changes the output significantly.
Converting between the two requires specific formulas, and a standard conversion table reveals how steeply the numbers diverge. A 100% markup, for example, equals only a 50% margin.
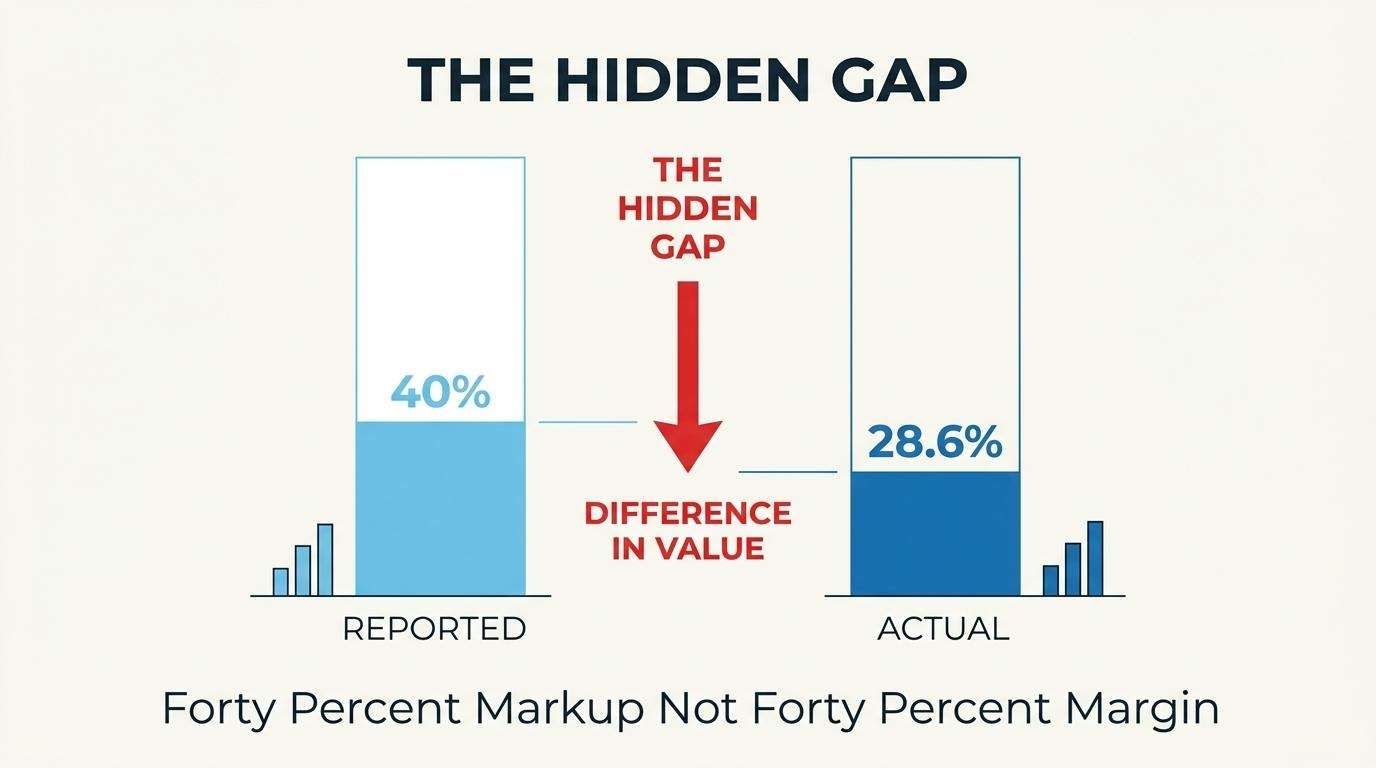
Mistaking markup for margin inflates profit expectations on every sale. A store owner reporting a 40% margin when the real figure is 28.6% creates a gap that compounds across daily sales volume and distorts financial projections.
Healthy markups and margins vary dramatically by vertical. Beauty brands sustain 100–233% markups and 50–70% gross margins, while food and beverage sellers work with 25–67% markups and 20–40% margins. Apparel return rates of 25–35% compress margins well below initial calculations.
Markup sets prices; margin measures profitability. Discounts shrink margins faster than the discount percentage suggests, subscription models require isolated margin tracking, and selling across multiple channels demands unified reporting to prevent data silos from hiding true per-channel performance.
Markup in ecommerce pricing is the percentage added to a product's cost to determine its selling price. The sections below cover how to calculate markup and what it looks like in practice.
Markup percentage is calculated by dividing the difference between selling price and cost price by the cost price, then multiplying by 100. According to Sage Advice Canada, the formula is: Markup = ((Selling Price – Cost Price) / Cost Price) × 100.
For a product that costs $50 and sells for $75, the calculation works as follows:
Because the denominator is always cost, not revenue, markup will always produce a higher percentage than margin on the same transaction. Keeping this distinction clear prevents pricing errors before they compound across your catalog.
An example of markup on a product is a unit that costs $80 to source and generates $20 in gross profit, yielding a 25% markup. According to Fishbowl Inventory, the formula expressed as (Gross Profit / Unit Cost) × 100 confirms this: ($20 / $80) × 100 = 25%.
That 25% markup means the item sells for $100. If the same seller applied a 50% markup instead, the selling price would jump to $120, while a 100% markup would double it to $160. Even small shifts in markup percentage create meaningful price differences at scale, which is why choosing the right percentage matters before listing a single product.
With markup defined, the next step is understanding how profit margin measures profitability from the opposite direction.
Profit margin in ecommerce is the percentage of revenue that remains as profit after costs are subtracted. The subsections below cover how to calculate margin percentage and what real product margins look like across sales channels.
Profit margin percentage is calculated by subtracting the cost price from the selling price, dividing the result by the selling price, and multiplying by 100. According to Sage Advice US, the formula is: Margin = ((Selling Price − Cost Price) / Selling Price) × 100.
Gross profit margin uses the same structure: (Revenue − Cost of Goods Sold) / Revenue × 100. This shows the percentage of revenue remaining after direct production costs. Net margin goes further, subtracting operating expenses, shipping, payment processing fees, and overhead from the equation.
One common pitfall worth noting: setting prices with markup but never checking actual margin performance creates a false sense of profitability that often persists until a formal financial review surfaces the gap.
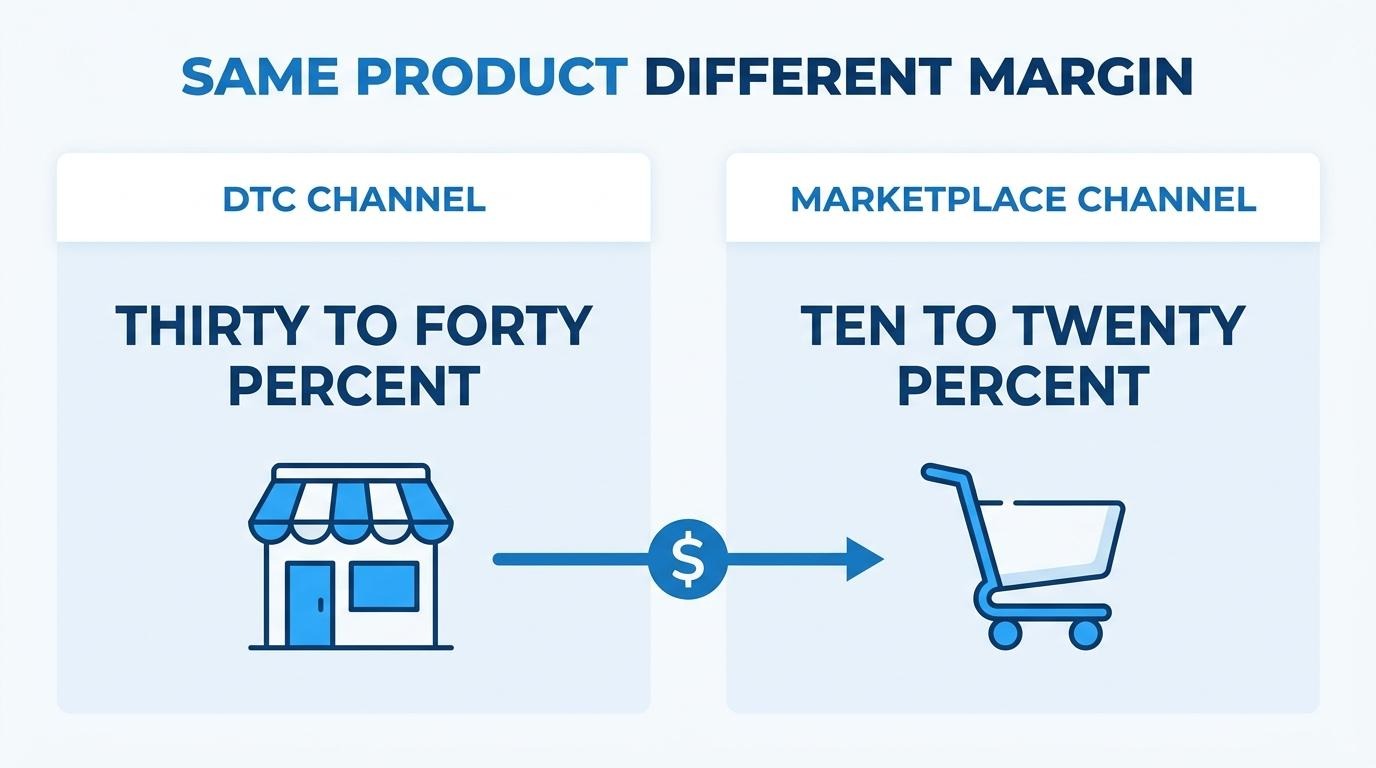
An example of margin on a product depends heavily on the sales channel. Consider a product with a $60 cost and a $100 selling price, which produces $40 gross profit and a 40% margin on a DTC storefront.
That same product on a third-party marketplace tells a different story. According to Webgility, DTC sellers typically retain 30–40% margins on comparable products, while marketplace sellers often keep just 10–20% before ad spend once referral fees, fulfillment fees, and advertising costs are deducted. The product, the cost, and the retail price stay identical; the channel economics compress the margin.
For brands selling across multiple channels, understanding margin per channel is more actionable than looking at a blended average.
People confuse markup and margin because both metrics use the same dollar amount of profit but express it as a percentage of a different base number. Markup divides profit by cost; margin divides profit by selling price. That single difference in denominator makes the resulting percentages diverge, and the confusion compounds when teams use the terms interchangeably.
According to National Retail Solutions, a product with a $70 cost and $100 selling price produces $30 in profit, which yields a 42.9% markup ($30 ÷ $70) but only a 30% margin ($30 ÷ $100). The same dollar profit, two different percentages. When a store owner applies a 40% markup and then reports a "40% margin" to their accountant, that accountant builds financial projections around a number that does not exist. The real margin is 28.6%, leaving a gap no one planned for.
This confusion persists because markup is always larger than margin for the same transaction. The selling price, which serves as margin's denominator, includes both cost and profit, so it is always a bigger number than cost alone. Without a clear mental model of which base each metric uses, even experienced operators default to treating the two as equivalent.
The consequences are not abstract. Overestimating margin by even a few percentage points inflates profit expectations across every transaction. Over hundreds of daily sales, that compounding error quietly drains cash from the business. For scaling brands managing pricing across multiple product lines, this kind of miscommunication between operations and finance is one of the most preventable yet common sources of margin leakage.
Understanding which metric answers which question is the fix: markup tells you how much to add above cost, while margin tells you how much of each revenue dollar you actually keep.
The markup and margin formulas use the same dollar values but divide by different bases, producing different percentages from identical transactions. Below, each formula is broken down with conversion methods between the two.
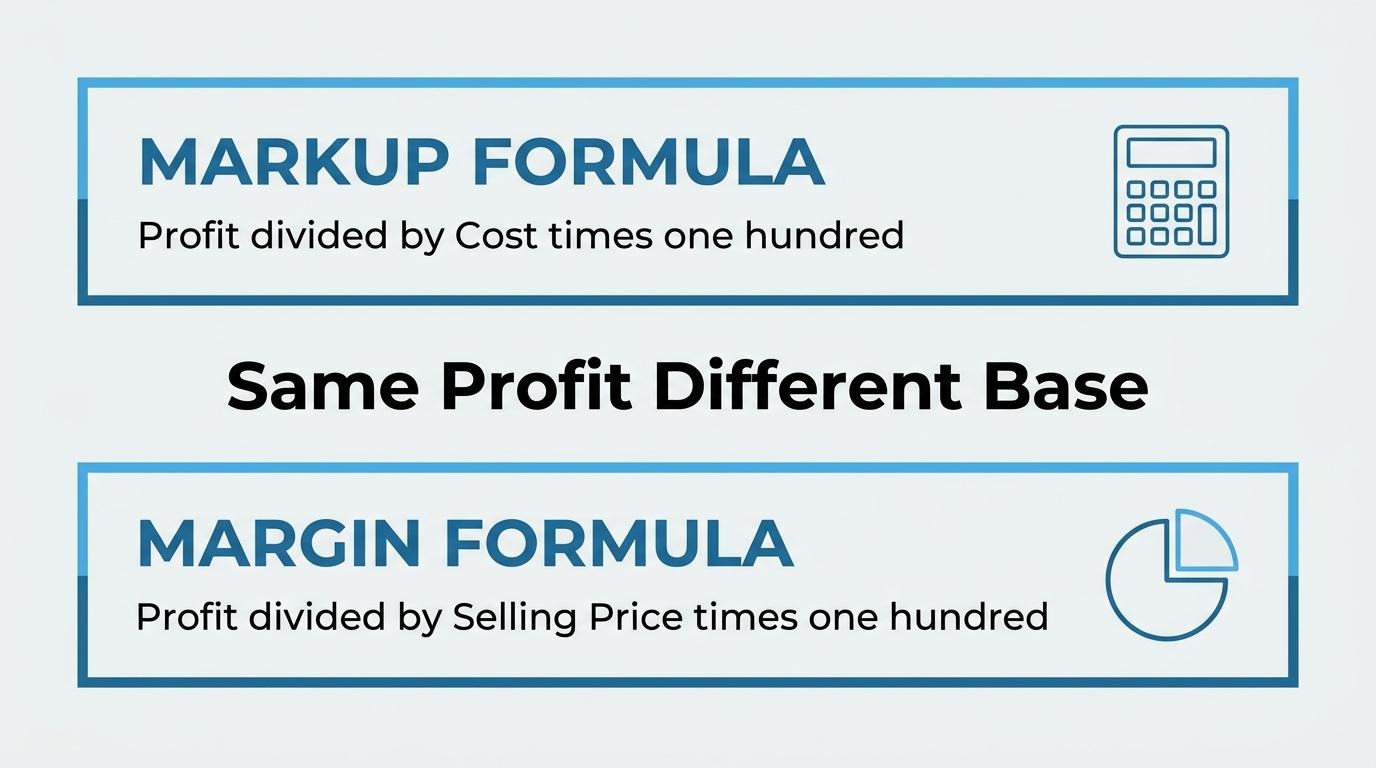
The markup formula is: Markup % = ((Selling Price – Cost Price) / Cost Price) × 100.
Cost price serves as the denominator. A product costing $80 that generates $20 in gross profit yields a 25% markup, according to Fishbowl Inventory. Because the calculation anchors to cost, markup tells you how much you added on top of what you paid. This makes it the natural formula for pricing decisions: you know your cost, you pick a multiplier, and the selling price follows directly.
The margin formula is: Margin % = ((Selling Price – Cost Price) / Selling Price) × 100.
Selling price serves as the denominator. According to Sage Advice US, margin shows the percentage of revenue remaining after direct costs are deducted. Because the denominator (selling price) is always larger than cost, margin is always a smaller percentage than markup on the same transaction. Investors, lenders, and accountants default to margin because it answers the question they actually care about: what share of each revenue dollar is profit?
You convert markup to margin using the formula: Margin % = Markup % ÷ (1 + Markup %). According to National Retail Solutions, a 50% markup converts to a 33.3% margin, not 50%.
Common conversions at a glance:
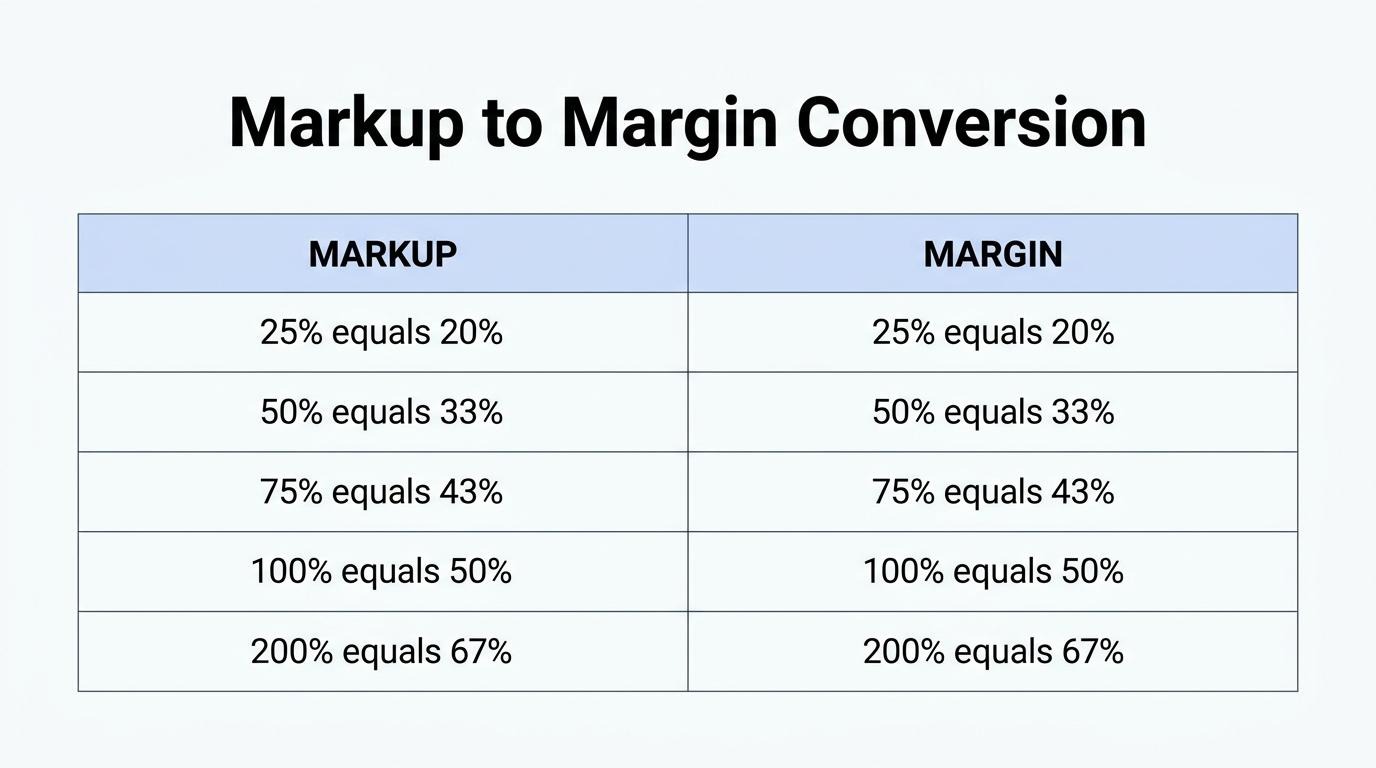
Markup % Margin %
15% 13.0%
25% 20.0%
50% 33.3%
75% 42.9%
100% 50.0%
150% 60.0%
You convert margin to markup using the formula: Markup % = Margin % ÷ (1 – Margin %). A 40% margin requires a 66.7% markup, and a 25% margin requires a 33.3% markup. Many sellers underestimate how steep the markup needs to be to hit a target margin; for this reason, running the conversion before finalizing any price is one of the simplest safeguards against underpricing.
With both formulas and conversion methods clear, the next step is understanding what happens when the two get confused.
Mistaking markup for margin causes you to overestimate profit on every sale. The gap between what you think you earn and what you actually keep compounds across hundreds of transactions, distorting financial projections, budgets, and pricing decisions.
A common scenario illustrates the damage: a store owner prices products using a 40% markup, then reports a 40% margin to their accountant. According to National Retail Solutions, the accountant builds financial projections on that 40% figure, but the real margin turns out to be just 28.6%, creating a gap nobody planned for. Over time, that 11.4-point discrepancy erodes cash reserves, inflates spending forecasts, and can leave a business unable to cover overhead it assumed was funded.
This error is especially dangerous because the numbers feel close enough to seem correct. A 50% markup produces only a 33.3% profit margin, not 50%. Many store owners never catch the difference until year-end financial reviews reveal unexplained shortfalls. When margin assumptions feed into inventory budgets, staffing plans, and ad spend targets, even a few percentage points of overestimation ripple across the entire operation.
The fix starts with recognizing which metric each audience needs. Lenders, investors, and accountants almost always think in terms of margin because they want to know what percentage of revenue is profit, not what percentage was added to costs. Internal pricing teams, on the other hand, naturally work from markup when building cost-plus models. Using the wrong metric in the wrong context quietly drains profitability, and the compounding effect across daily sales volume makes it one of the most costly yet preventable errors in ecommerce pricing.
Understanding the real-world stakes of this confusion sets the stage for choosing the right markup percentage by product category.
A good markup percentage for ecommerce products depends on the category. Fashion brands, beauty lines, food sellers, and home goods retailers each operate with different cost structures and competitive pressures.
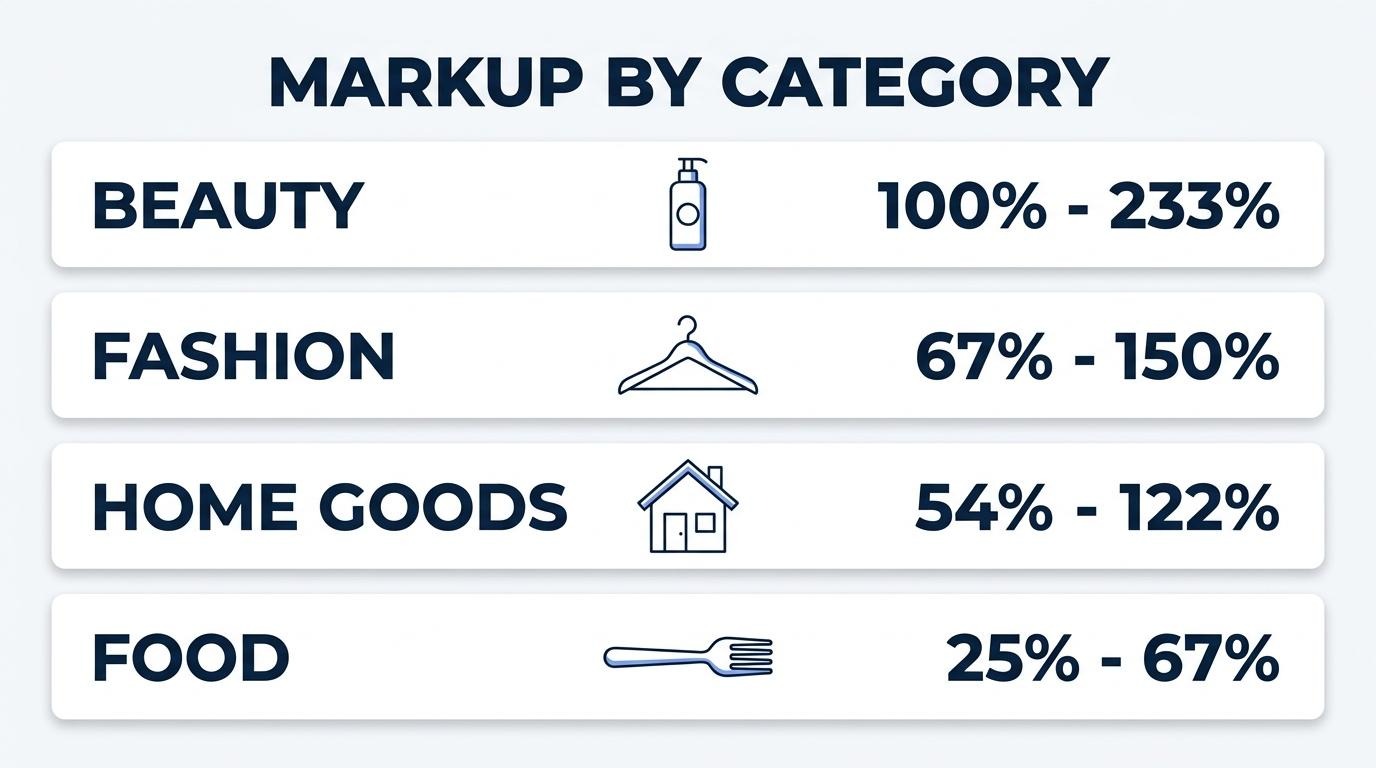
Fashion and apparel brands typically use markups ranging from roughly 67% to 150%, which correspond to the industry's 40–60% gross margin range. Fast fashion and basics cluster toward the lower end, while premium labels push toward 100–150% markups to sustain 50–60% margins. According to Northstar Financial Advisory, apparel returns average 25–35% in ecommerce, compared to 10–15% for most other categories, which means initial markups must be high enough to absorb post-return margin compression. For any apparel brand, building return costs into the original markup is not optional; it is a survival requirement.
Beauty and skincare brands typically use markups between 100% and 233%. Raw material costs in this category are remarkably low, often $2 to $5 per unit for products retailing at $30 to $80, according to Northstar Financial Advisory. That cost structure supports gross margins of 50–70%, placing beauty among the highest-margin ecommerce verticals. Skincare specifically achieves 65–70% margins when formulation and packaging costs remain controlled. Because perceived value drives purchasing decisions more than ingredient cost, brands that invest in packaging, education, and brand storytelling can sustain markups at the upper end without significant price resistance.
Food and beverage brands typically use markups ranging from 25% to 67%, reflecting the category's tighter gross margins of 20–40%. According to eSellSphere, industry benchmarks place food and beverage gross margins in that 20–40% band. Perishability, cold chain logistics, and heavier shipping weights compress what sellers can charge above cost. Within the category, beverages like specialty coffee or energy drinks command higher markups (sometimes 100%+), while grocery staples sit at 5–25%. This is a volume-dependent category where thin per-unit markups need high order frequency or subscription models to produce meaningful profit.
Home goods brands typically use markups between 54% and 122%, yielding gross margins of 35–55%. Small, lightweight items like candles achieve margins of 45–55% because fulfillment costs remain proportionally low. Large, heavy items like furniture compress to 35–42% margins since inbound freight and outbound shipping consume disproportionate shares of the selling price, according to Northstar Financial Advisory. For home goods sellers, the markup decision is inseparable from product weight and dimensions. Brands selling bulky items often need to offset lower per-unit margins through higher average order values or bundled accessory sales.
Understanding typical markups by category sets the foundation, but markup alone does not reveal profitability; the next section examines what constitutes a good profit margin across these same verticals.
A good profit margin for ecommerce products ranges from 40% to 80% gross margin, depending on category. According to K38 Consulting, this range far exceeds traditional retail, where gross margins typically fall between 21.88% and 34.17%. The sections below break down typical margins for fashion, beauty, food, and home goods.
Fashion and apparel brands typically achieve 40–60% gross margins. Fast fashion and basics cluster around 40–48%, while premium brands reach 50–60%. However, these headline numbers can be misleading without accounting for returns.
According to Northstar Financial Advisory, apparel returns average 25–35% in ecommerce, compared to 10–15% for most other categories. A product showing a 55% gross margin before returns can drop to 42% after factoring in return shipping, inspection, repackaging, and markdowns on resold items. For apparel sellers, the real margin lives in what remains after the return cycle, making sizing tools and detailed product photography as much margin protection strategies as conversion tactics.
Beauty and skincare brands typically achieve 50–70% gross margins. Skincare products specifically reach 65–70% because raw material costs are remarkably low, often $2 to $5 per unit for products retailing at $30 to $80, according to Northstar Financial Advisory.
These margins make beauty one of the highest-margin ecommerce categories. Low return rates compared to apparel help protect those margins post-sale. Brands that layer in subscription models or loyalty programs can compound this advantage, since repeat purchasers carry near-zero incremental acquisition cost. For scaling DTC beauty brands, maintaining gross margins above 60% is realistic if COGS discipline stays tight.
Food and beverage brands typically achieve 20–40% gross margins, according to eSellSphere industry benchmarks. This places food and beverage among the lower-margin ecommerce categories.
Several factors compress these margins:
Subscription models can partially offset these challenges by improving demand predictability and reducing per-order acquisition costs. Even so, food brands need tighter operational control than higher-margin categories to stay profitable.
Home goods brands typically achieve 35–55% gross margins. Small, lightweight items like candles reach 45–55%, while large, heavy items like furniture compress to 35–42% because inbound freight and outbound shipping consume disproportionate shares of the selling price, according to Northstar Financial Advisory.
This category illustrates why product weight and dimensions matter as much as COGS when evaluating margin health. A candle brand and a furniture brand may both sell "home goods," yet their margin profiles differ by 15–20 percentage points. Brands selling across multiple product sizes should calculate margin at the SKU level, not the category level, to avoid averaging away real profitability gaps.
Understanding category-specific margins sets the foundation; the next step is deciding whether markup or margin should drive your actual pricing decisions.
You should use both markup and margin, but for different purposes. Markup sets your selling price; margin measures your profitability. The sections below clarify when each metric serves you best.
Markup is more useful than margin when you need to set or adjust selling prices quickly based on known costs. If you know a product costs $40 and your category standard is a 100% markup, you price it at $80 without needing to calculate backward from a target revenue figure.
This cost-up approach works well for initial pricing, quoting wholesale orders, and standardizing prices across large catalogs. However, clarity matters: according to Rippling, setting a "50% margin" when you actually mean "50% markup" results in much lower profitability than intended, and these miscommunications can lead to underpricing. For day-to-day price-setting where cost is your anchor, markup is the faster, more intuitive tool.
Margin is more useful than markup when you need to evaluate business health, forecast profitability, or communicate with stakeholders. Lenders, investors, and accountants think in terms of margin because it shows what percentage of revenue is actual profit.
Margin also becomes essential when running promotions, comparing channel performance, or building financial projections. A 70% margin requires roughly a 233% markup, while a 60% margin requires roughly a 150% markup, according to LinkedIn's strategic pricing analysis. These large gaps illustrate why relying solely on markup can obscure how much revenue you actually retain. For any decision that involves profit analysis rather than price-setting, margin gives you the clearer picture.
Understanding when to apply each metric keeps pricing decisions accurate and financial reporting honest.
Discounts and promotions affect margin vs markup by shrinking profit dollars while leaving cost of goods sold unchanged, which means margin drops faster than the discount percentage suggests. The subsections below break down why this asymmetry occurs, how to calculate the real cost of a promotion, and what volume increase you actually need to break even.
Discounts shrink margins faster than expected because COGS, shipping, and payment processing stay fixed when selling price drops. A 20% price reduction does not produce a 20% profit reduction; it produces a much steeper one. According to Saras Analytics, a 20% discount on a product with a $50 retail price and $50 gross profit can reduce profit from $50 to $30, a 40% profit reduction from just a 20% discount.
This asymmetry catches merchants off guard. Markup percentage also drops, but because markup uses cost as its denominator (which remains constant), the percentage decline looks smaller than the margin decline on the same transaction.
You calculate the true cost of a promotion by comparing gross profit per unit before and after the discount, then determining how many additional units you need to sell to recover lost profit. Start with the pre-discount margin formula: (Selling Price - COGS) / Selling Price. Then recalculate with the discounted selling price.
If profit per order drops from $30 to $10, the promotion requires three times the volume just to break even on total gross profit. Frequent discounting compounds this problem because margin erosion can make it difficult to cover fixed operational costs at all. Before launching any sale, run the breakeven volume calculation; if the required lift seems unrealistic for your category, the promotion will lose money.
Discount strategies that protect margins include tiered thresholds, bundling, and conditional offers that raise average order value instead of simply cutting price. These approaches offset the per-unit margin loss by increasing total cart revenue.
Effective margin-protective tactics include:
For brands running promotions frequently, tracking post-discount margin per SKU, not just top-line revenue, is the only way to know whether a sale actually helped the business.
Markup vs margin applies to subscriptions by narrowing the calculation scope to only recurring revenue and the costs that directly support it. Below, the key differences in how subscription models handle cost structures, margin benchmarks, and pricing logic are broken down.
Subscription revenue margins follow the same gross margin formula but isolate subscription-specific revenue and expenses, including support, customer success, and DevOps departments. According to The SaaS CFO, this narrower scope means the cost base looks fundamentally different from one-time product sales, where COGS centers on materials and fulfillment.
That distinction changes everything about how markup translates into margin for recurring models. With physical subscriptions (like supplement boxes or skincare refills), raw material costs often stay low while fulfillment and retention costs recur. For SaaS or digital subscriptions, infrastructure and support staff represent the primary cost inputs rather than physical goods.
Benchmark margins reflect this structural difference. According to G Squared CFO, subscription gross margins in a mature SaaS business typically run 75 to 80% or higher. Physical product subscriptions generally sit lower, though health and wellness subscription operators achieve 40 to 55% of revenue from subscriptions with margins boosted by low per-unit raw material costs.
The markup calculation still sets the initial price. However, because subscription customers are acquired once and retained for multiple billing cycles, the effective customer acquisition cost spreads across a longer revenue lifetime. A markup that appears thin on a single order can produce strong cumulative margins when retention holds steady.
For brands managing subscriptions alongside one-time purchases, tracking margin separately for each revenue stream prevents the blended number from masking underperformance. This becomes especially important when subscription discounts (common "subscribe and save" offers) compress per-order margin in exchange for higher lifetime value.
With subscription margins isolated, tracking accuracy across all sales channels becomes the next operational challenge.
You track margins accurately across sales channels by consolidating order, payment, and inventory data into a single system. The subsections below cover how disconnected data distorts margins, what unified reporting changes, and key takeaways on markup vs margin.
Disconnected POS and web data distorts margins by creating separate data silos that prevent accurate per-channel profitability calculations. When in-store POS transactions, marketplace payouts, and DTC storefront revenue sit in different systems, each channel reports its own version of cost and revenue figures. According to ETP Group, a multi-channel POS system that manages channels in parallel but separately creates data inconsistencies and operational fragmentation that distorts true margin calculations.
Reconciling these mismatched numbers manually introduces errors. Fee structures differ across channels, payout timing varies, and inventory costs may be allocated inconsistently. Without a single source of truth, the margin you calculate for any given SKU is only as reliable as the weakest data feed.
Margin data living in one system enables real-time, per-channel profitability reporting with consistent cost allocation. A multi-channel order management system connects all sales channels into a single platform, syncing orders, inventory, and fulfillment to produce unified margin reports.
Key improvements from consolidated margin data include:
According to Swell, when POS data flows seamlessly across channels, supply chain efficiency improves by 15% through better demand forecasting and optimized inventory management. For brands selling across three or more channels, this kind of consolidation is not optional; it is the only way to know which channels genuinely earn their margin and which ones quietly erode it.
The key takeaways about markup vs margin center on three principles: they measure the same profit differently, confusing them leads to mispriced products, and tracking both per channel is essential.
Understanding both metrics, and applying them correctly, is what separates pricing that looks profitable on paper from pricing that actually sustains a business at scale.